Significant Risk Transfer:
A Market That Has Grown Up and Is Still Growing
Significant Risk Transfer (SRT) has moved well beyond its origins as a niche regulatory tool into one of the most dynamic segments of the structured credit market. What started as a way for banks to manage capital more efficiently has evolved into a market with its own depth, discipline and room to grow. As banks grapple with stricter capital requirements and increasing pressure on their balance sheets, SRT transactions, usually carried out through synthetic securitizations, have emerged as a vital strategy for optimizing capital, distributing risk, and maintaining lending capacity.
In essence, the fundamental premise has not changed—banks retain the loans while investors take on a defined portion of credit risk through guarantees, derivatives, or credit-linked notes (CLNs). The shift is in the variety of structures and a greater focus on standardization.
According to The Bank for International Settlements (BIS), SRT issuance has increased nearly fivefold since 2016, with transactions referencing close to €800 billion in underlying loan portfolios by the end of 2024, supported by about €72 billion (9%) of risk transfer. Looking ahead, the market appears to be crossing another inflection point. Industry estimates suggest the notional of securitised assets protected via SRT would have moved past the €1 trillion mark, with tranche volumes exceeding €90 billion. Bloomberg estimates the 2026 tranche issuance to be c. €50 billion, showing a rampant growth over the last decade. While SRT still remains a small part of the overall bank balance sheets, the growth is notable. Regulatory tailwinds and capital efficiency benefits have set the stage for further growth in the coming years.
What is perhaps more telling is how this growth is translating into portfolio characteristics on the ground. Data tracked on Oxane Panorama, which captures SRT activity across 50+ banks, provides a useful lens into this shift. The platform reflects a cumulative of over €280 billion protected portfolios alongside note issuances of around €35 billion till early 2026, offering a representative cross-section of the market. A closer look at this dataset brings out some important patterns around how risk and returns have been positioned within these transactions.
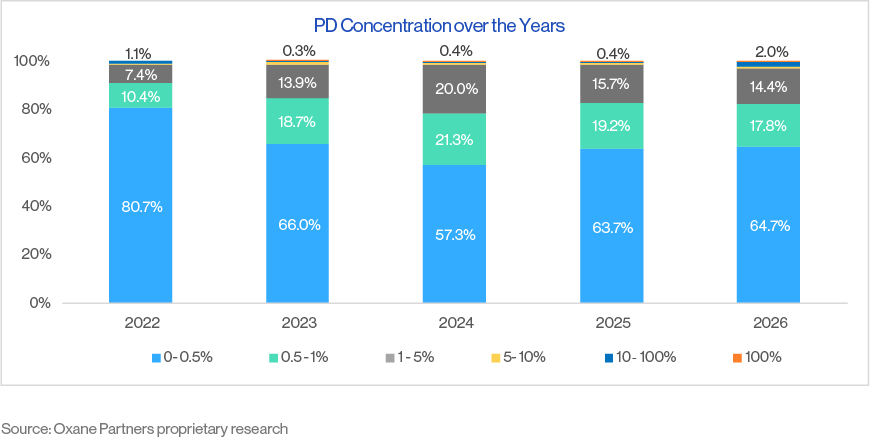
In 2022, credit quality across these portfolios was clearly skewed toward the lowest end of the risk spectrum. Almost 80% entities were concentrated in the sub 0.5% probability of default (PD) bucket, indicating strong underlying asset performance. Around 18% fell within the 0.5%–5% PD range and a negligible share exhibited default probabilities above 5%.
Since then, the distribution has continued to evolve. Changes in global economic outlook and evolving dynamics have gradually reshaped risk concentrations, leading to a discernible re‑alignment toward moderate‑risk segments. As seen in 2025, mid 60% of the entities sat in the lowest PD bucket of 0%–0.5%. Nearly 35% of the population saw a shift to 0.5%–5% and the balance spread across higher risk categories. Notably, the proportion of entities in the 10%–100% PD bucket has increased to around 2%, up from roughly 0.4% earlier. While still a relatively small component, this uptick highlights a broader recalibration in how credit risk is being positioned within SRT structures as market conditions evolve.
The chart below illustrates this progression, highlighting how credit risk composition has adjusted over time.
A closer look at sector-level data makes this divergence clear.
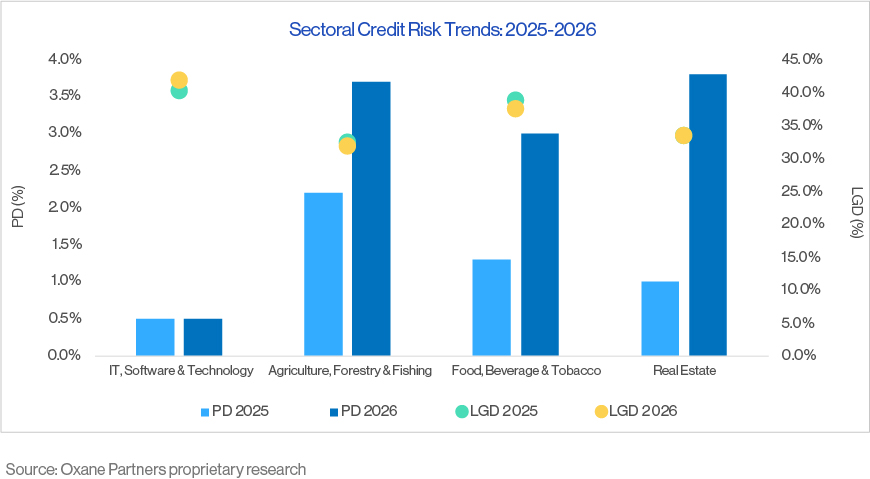
The IT, Software and Technology sector continues to display relatively stable credit quality, with PDs hovering around 0.5%. In contrast, the Agriculture, Forestry and Fishing sector has experienced a notable rise in default risk, with PD increasing from approximately 2.2% in 2025 to 3.7% by the first quarter of 2026. This shift has occurred without a corresponding notable change in Loss Given Default (LGD) assumptions. A similar pattern is evident in the Food, Beverage and Tobacco sector, where PDs rose from around 1.3% in 2025 to approximately 3.0% in Q1 2026. The most pronounced movement has been observed in Real Estate, with default probabilities climbing sharply to nearly 4% in early 2026 from an average of roughly 1% in 2025, even as LGD expectations have remained unchanged.
The apparent disconnect between rising default probabilities and relatively static loss expectations are indicating to the significant role of structural and contractual features in determining loss outcomes with the evolving underlying credit risk. Structural features such as replenishment condition also play an equally crucial role in determining the overall credit risk of the portfolio. Observed data highlights higher default probabilities in deals without replenishment condition, or in deals with replenishment once such period is over, relative to the pre-replenishment phase.
However, despite this gradual uptick in risk across SRT portfolios, investor returns have come under pressure. Even with greater risk, tranche margins are seeing compression. Margins have tightened by almost 3% between 2023 and early 2026 across first loss and mezzanine protections.
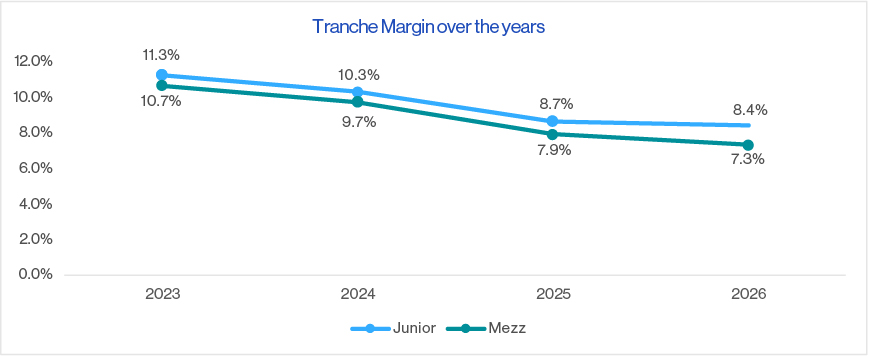
Growing issuance, wider participation and gaining popularity of the SRT market is pushing the investors to compete more aggressively for allocations, thus intensifying competition. As a result, pricing is drifting away from the inherent risk-return fundamental and leaning more towards the demand-supply mechanics.
However, this pricing pressure has not dented investor appetite. Demand has continued to remain resilient, underpinned by the structural appeal of the asset class. SRT tranches continue to offer access to diversified pools of bank-originated credit that are otherwise difficult to source, along with relatively attractive risk‑adjusted returns and structural flexibility. The combination of steady demand and structural standardisation has, in turn, supported pricing compression without dampening volumes.
Looking ahead
As the SRT market scales and regulatory scrutiny deepens, keeping pace with structural shifts and valuation nuance is becoming just as important as tracking issuance volumes. While the market is expected to maintain its momentum as a high‑growth segment through 2026 and beyond, the next phase of expansion is likely to be characterised less by volume alone and more by increased discipline. Standardisation, maturing investor appetite, and heightened regulatory scrutiny are all pointing towards a market that isn’t merely growing bigger but growing up.